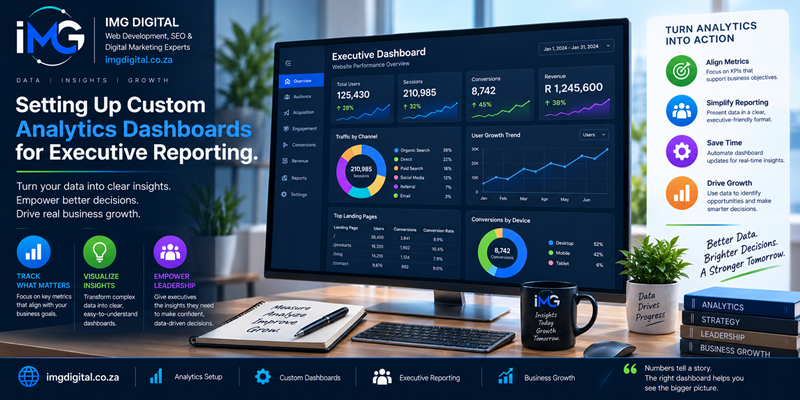
Setting Up Custom Analytics Dashboards for Executive Reporting – Modern organizations generate massive volumes of digital analytics data daily. In the past, business leaders relied on static monthly PDF reports to evaluate web performance and marketing outcomes. However, static spreadsheets fail to deliver real-time insights required for fast strategic decision-making.
Setting Up Custom Analytics Dashboards for Executive Reporting
Specifically, executive teams do not have the time to filter through thousands of operational data rows inside Google Analytics 4. As a result, data analysts must translate complex web metrics into clean visual narratives. Therefore, setting up custom analytics dashboards for executive reporting is essential for aligning digital marketing performance with high-level business goals.
Understanding the Purpose of Executive Analytics Reporting
Executive decision-makers operate with fundamentally different data requirements than day-to-day marketing managers. While operational teams analyze micro-level details—such as individual keyword rankings or bounce rates on specific blog posts—c-suite leaders focus on high-level growth drivers. Consequently, presenting raw operational data to executives causes information overload and confusion.
To ensure strategic clarity, custom executive dashboards must bridge the gap between technical web metrics and financial performance. For instance, instead of simply displaying total pageviews, an executive dashboard highlights Customer Acquisition Cost (CAC), Return on Ad Spend (ROAS), and total lead pipeline value. Furthermore, visualizing these Key Performance Indicators (KPIs) over time allows leadership to identify strategic growth opportunities instantly. Therefore, building tailored dashboards transforms raw analytics into actionable strategic intelligence.
Core Principles for Building High-Impact Dashboards
Designing a custom dashboard requires applying clear data visualization and user experience principles. If a dashboard appears visually cluttered, decision-makers struggle to extract meaningful insights.
-
Focus on North Star Metrics: To begin, restrict primary dashboard screens to top-level business goals. Specifically, display core financial indicators and conversion totals prominently at the top of the interface.
-
Establish Visual Hierarchy: In addition, structure layout components logically. Because human eyes scan digital screens from top to bottom, place high-level summary scorecards at the top, followed by trend line charts and regional breakdowns.
-
Maintain Strict Data Hygiene: Furthermore, verify that underlying data connections execute clean transformations. If duplicate data sources or unfiltered spam traffic enter dashboard reports, executive confidence in analytics erodes rapidly.
Step-by-Step Workflow for Setting Up Custom Dashboards
Constructing an automated executive dashboard requires a structured engineering approach across business intelligence platforms like Google Looker Studio or Power BI.
Step 1: Select and Connect Primary Data Sources
First, identify every critical data repository powering your business ecosystem. By utilizing native data connectors, link your analytics platform—such as Google Analytics 4—alongside CRM systems, Google Ads, and e-commerce databases. Consequently, your business intelligence tool aggregates multi-channel performance within a single centralized platform.
Step 2: Define Data Calculations and Custom Fields
Second, create custom calculated fields to derive high-level metrics directly inside the dashboard environment. For example, calculate Conversion Rate percentages or Average Revenue Per User (ARPU) by combining raw transaction totals with user session counts. As a result, executives view synthesized growth metrics without manual calculations.
Step 3: Design Intuitive Visualizations and Controls
Third, select the appropriate chart types for each metric. Specifically, use scorecard widgets for single total values, line charts for historical trends, and bar charts for channel comparisons. In addition, integrate dynamic date-range pickers and regional filter controls. Consequently, executives can explore dynamic performance metrics across custom timeframes effortlessly.
Distinguishing Operational Data from Executive Metrics
Understanding which data points belong on an executive dashboard is critical for maintaining visual clarity and strategic alignment.
| Reporting Category | Operational Team Metrics | Executive Leadership KPIs |
| Traffic Analytics | Pageviews, Bounce Rate, Session Duration | Qualified Users & Multi-Touch Attribution |
| Marketing Performance | Ad Click-Through Rates (CTR), Impressions | Customer Acquisition Cost (CAC) & ROAS |
| Lead Generation | Form Field Submissions & Clicks | Sales Pipeline Value & Conversion Rate |
| Revenue Impact | Individual Product Sales Count | Customer Lifetime Value (LTV) & Total MRR |
On one hand, operational metrics help marketing teams optimize daily campaigns. On the other hand, executive KPIs provide leadership with clear indicators of overall business health and profitability. Multi-Platform Digital Campaigns: Streamlining Cross-Channel Web Traffic
Automating Distribution and Maintaining Data Integrity
Creating a custom dashboard represents only part of a long-term reporting strategy. To ensure decision-makers utilize analytics regularly, analysts must automate reporting workflows. Specifically, configure automated email delivery schedules within Looker Studio or Power BI to send weekly summary snapshots directly to executive inboxes. In addition, perform routine audits of API connections and schema mappings. Because updates to source platforms can interrupt data pipelines, continuous validation guarantees data accuracy. Consequently, executive leadership maintains complete trust in automated reporting assets.
Summary
In conclusion, setting up custom analytics dashboards for executive reporting is an indispensable practice for modern data-driven organizations. By translating raw web traffic into executive KPIs, structuring clear visual hierarchies, and automating data distribution, analysts empower leadership to make informed decisions rapidly. Furthermore, eliminating operational noise highlights true revenue drivers and growth opportunities. Ultimately, mastering executive dashboard implementation ensures that digital analytics investments deliver measurable business growth and sustainable competitive advantage.